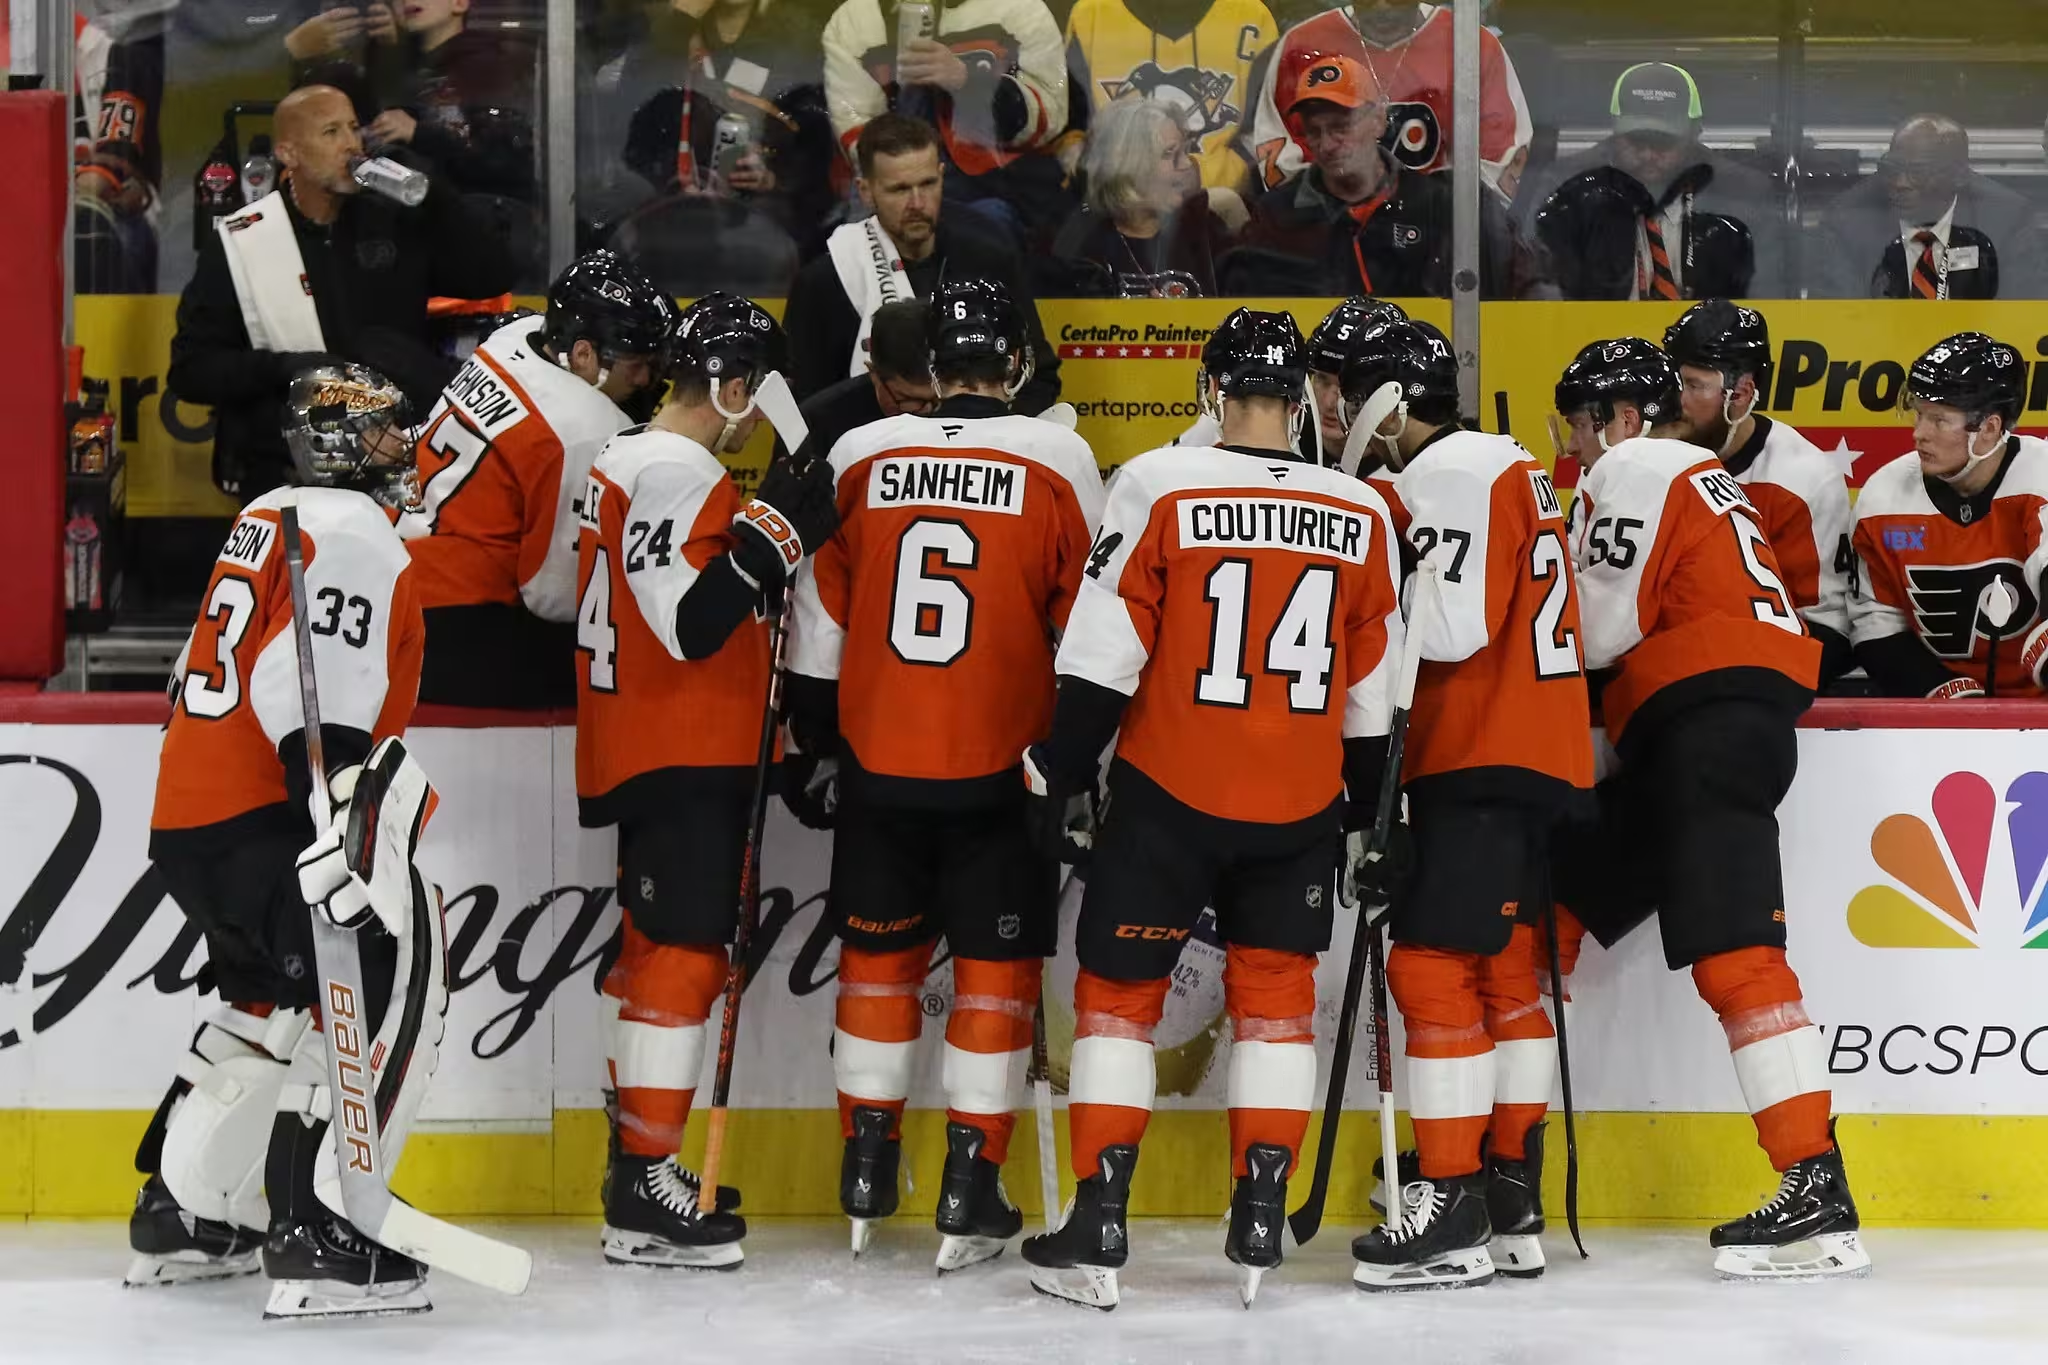
Through 14 games, the Philadelphia Flyers are separated from the NHL’s basement by two points. At 5-8-1, they have not played up to expectations. Here are three key reasons why head coach John Tortorella‘s club has started slow.
Reason One: Flyers’ Offense Is Doing Less with Less
Now, what does “doing less with less” mean? The Flyers have less because they have seen their even-strength possession rates plummet to the basement this season. That was what allowed their talent-scarce roster to be largely competitive in 2023-24, providing optimism that they could run it back. Having the puck on their stick was essential to their success, as outlined in the related piece below:
Related: Philadelphia Flyers’ X-Factor for 2024-25: Puck Possession
Let’s quantify the team’s drop-off in puck possession. In 2023-24, these were the Flyers’ possession numbers in all three zones per NHL Edge:
- 41.7 percent in the offensive zone (8th in NHL)
- 18.8 percent in the neutral zone (7th in NHL)
- 39.7 percent in the defensive zone (6th in NHL)
In 2024-25? They have stooped to these levels:
- 39.7 percent in the offensive zone (24th in NHL)
- 18.7 percent in the neutral zone (10th in NHL)
- 41.6 percent in the defensive zone (25th in NHL)
As a result, the Flyers have gone from being ranked fifth per 60 minutes in even-strength shot attempts, 10th in shots on goal, and 18th in expected goals to 30th or lower in each of those statistics from last season to this one. It might seem small, but a two-percent differential in offensive zone possession can be detrimental to generating good looks.
However, these metrics have regressed so severely for another reason, too. The Orange and Black aren’t doing much with the puck even when they get it. If we eliminate puck possession as a factor, the Flyers’ results have crumbled from their previous campaign to this one. Per 60 even-strength minutes of possession in the offensive zone, they have seen significant decreases in key statistics:
- 11.33 percent decrease in shot attempts for (152.83 to 135.52)
- 19.28 percent decrease in shots for (77.70 to 62.72)
- 12.84 percent decrease in expected goals for (6.62 to 5.77)
- 12.62 percent decrease in goals for (6.26 to 5.47)
Not only have the Flyers had the puck less this season, but they are doing less with it. Due to their unique lack of talent, Philadelphia needs to take more shots than other teams to score enough…
Click Here to Read the Full Original Article at The Hockey Writers…

